
15 min
Over the past couple of weeks, we have seen a range of easing measures announced by the Australian State and Federal Government. While this may be a welcome relief to many of us, a number of questions remain. Does this now mean we are on the path back to some sense of normality? Have we moved too soon? What does “normality” look like, anyway?
Following on from our Q&A with Guy Bruten, Chief Economist—Asia-Pacific ex China, where he discussed the five key policy markers our team of economists have been tracking, we got his views on the easing of lockdown measures and what signals we should be looking for as we continue the recovery post-coronavirus.
In terms of the five policy markers set out in the Q&A previously, this is where we now stand:
1. The suite of non-pharmaceutical interventions in Australia – border closures, social distancing measures, shutdowns, travel restrictions, and so on – looks to have been successful at controlling the spread of covid-19 through the community. The daily count of new cases and new deaths has fallen to very low levels, which has allowed the government to look at opening up the economy.
2. Policies aimed at limiting the income damage—the critical flipside to the public health policy—also appear to have been effective. Schemes such as “jobkeeper” (Australia’s version of a wage subsidy program) and “jobseeker” (unemployment benefit, the allowance of which has doubled as a result of COVID-19) were aimed at placing parts of the economy into “suspension”—ready to resume when permitted—rather than letting them collapse. While some businesses and individuals are still falling through the cracks, the policies look to have provided the scale and scope of fiscal support required.
That said, there will still be perturbing economic data to come—the April employment numbers are a prime example showing the number of people with jobs falling by almost 600,000 in the month. The unemployment rate rise from 5.2% to 6.2% may not seem as bad as expected, this figure was “saved” by a collapse in participation i.e. a decrease in unemployed jobseekers. As these people are not actively seeking work, they are not counted as unemployed and therefore clouds the true picture, which is likely much worse.
3. Financial stress has been relieved to some extent by the take-up of flexibility provisions from the banks. Mortgage and business loan repayments have been delayed while more than 1.2 million Australians have sought to withdraw ~A$10 billion from their superannuation accounts. Consequently, these measures appear to have helped to prevent – or at least postpone – the usual recessionary narrative where job stress leads to financial stress, foreclosures and bankruptcies, which lead to more job losses, more financial stress, and so on.
4. Importantly, there has been a clear willingness from policy makers and central bankers to go above and beyond any measures seen previously, with most major economies providing support measures of ~10% of their GDP (more in some cases), facilitated by central banks adopting a raft of unconventional policy initiatives. The Reserve Bank of Australia’s (RBA) yield curve control program is a great illustration of those policies in action; effectively committing to purchase whatever amount of government bonds is necessary to keep yields low and stable, and markets functioning smoothly.
5. Of course, we’re not out of the woods. The fifth marker, as to whether there has been and will be enough fiscal stimulus provided to kickstart the economy once we get into the post-lockdown regime remains to be seen.
In other words: so far, so good. Australia stands outs, along with a number of other countries in the Asia Pacific region—New Zealand, South Korea, Taiwan, Hong Kong among others—where through swift policy action and luck the virus has been brought under control.
So, what are we focusing on as we navigate through the next phase? The below are four signals to look for and why they matter:
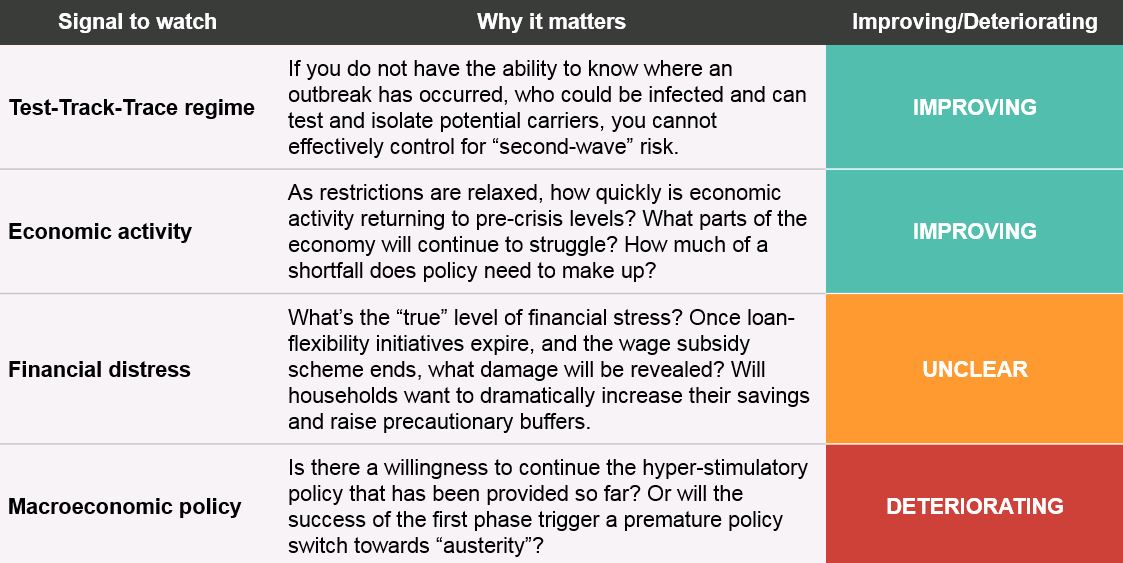
Test-Track-Trace regime
On testing, Australia is doing relatively well with ~30,000 tests/day and a loosening in testing criteria where even those with the mildest symptoms can come forward. This is a relatively high number of tests per capita and is yielding a low rate of positive tests at just 0.1%. The introduction of the mobile app (which has had over 5 million downloads so far) will help to assist with tracing those that may have come into contact with a positive case without realizing (i.e. the person is not known to them). However, even the best programs can have blind spots (e.g. Singapore) and it therefore should be assumed that Australia will encounter these as well as lockdown measures ease—and that’s where the effectiveness of the test-track-trace regime will be revealed.
Economic activity
As shown below, there are several high frequency non-official data sources that we can use to get handle on the extent of recovery: Google mobility trends, Apple mobility data and CityMapper data all give a sense of the improvement in economic activity.
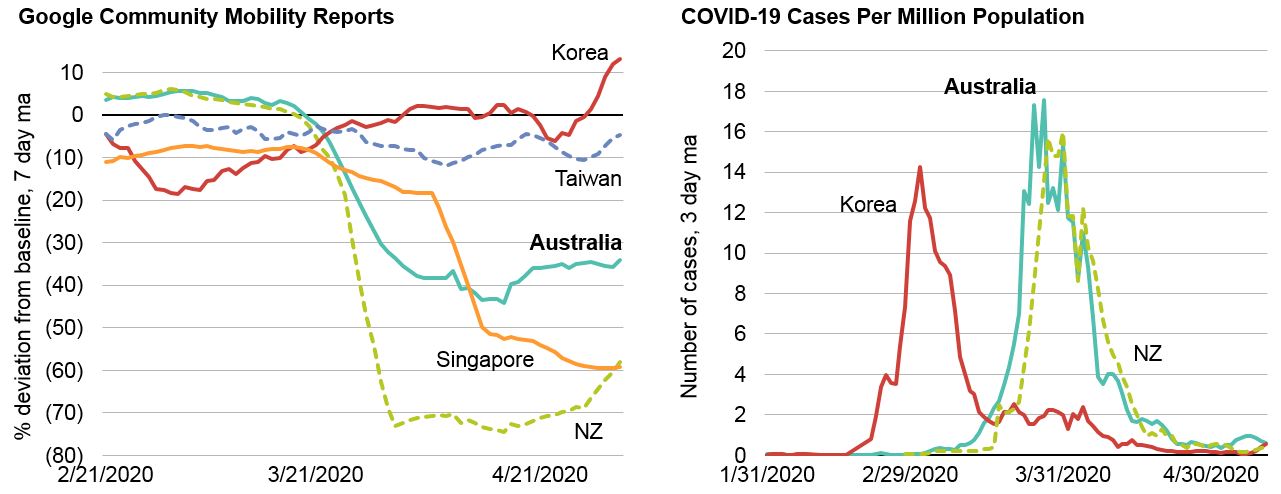
Source: Left -- google.com COVID-19 Mobility Report. Through 02 May 2020. Right – ourworldindata.org. Through 11 May 2020
Electronic card transactions processed through the major banks can help to gauge spending trends. And the Australian Bureau of Statistics has also started publishing useful and timely data on aspects of the COVID-19 impact, for example, weekly data series on payrolls and wages. Data from early May, when lockdown measures began to be eased, shows an encouraging start. Apple mobility data which showed a 21.7% increase in requests for driving directions on the first Saturday of May, while retail spending was up by 70 per cent in Queensland in the week to May 3, 2020—albeit from a low base. As the restrictions are lifted, a material improvement in activity was always on the cards. But key is where the new “normal” settles: how close to pre-crisis levels? And at what pace does spending grow from there?
Financial distress
One thing that will influence that latter point is the degree of underlying financial stress. Once the financial relief and fiscal support measures roll off, how much pressure will remain on households and businesses? Will there be a desire to increase buffers and to raise the level of precautionary saving? And will these be large enough to have a macroeconomic impact. The true picture here may only emerge as we get towards the end of year. But in the interim, we’re monitoring things like the appetite for new borrowing and the assessment of future financial situation from of the consumer sentiment surveys.
Macroeconomic policy
Clearly, the support measures announced so far have been beyond anything announced previously and that raises concerns about sustainability. But there are three elements that may require this to continue, or even extend. This goes beyond the bounce that we’ll see once restrictions are lifted – and to the question of what “normal” is going to look like. First, the macroeconomic effect of changes in behavior as we potentially see a more cautious approach from consumers. Second, to recognize that several restrictions will remain for an extended period such as foreign travel and third, to recognize that even as constraints are lifted, there will a long and disruptive transition process as the pattern of consumer spending shifts (in some cases permanently) and as businesses adjust to new modes of delivery. But with the danger of a near term breakout in inflation remaining low (if anything, the near-term risks are tilted to the downside), and with the RBA committing to keeping rates low and stable, the “path of least regret” would argue for more stimulus, for longer.
This information is for exclusive use of the wholesale person to whom it is provided and not to be relied upon by any other person. This document has been prepared by AllianceBernstein Australia Limited (“ABAL”)—ABN 53 095 022 718, AFSL 230 698. Information in this document is only intended for persons that qualify as “wholesale clients,” as defined by the Corporations Act 2001, and is not to be construed as advice. This document is provided solely for informational purposes and is not an offer to buy or sell securities. The information, forecasts and opinions set forth in this document have not been prepared for any recipient’s specific investment objectives, financial situation or particular needs. Neither this document nor the information contained in it are intended to take the place of professional advice. You should not take action on specific issues based on the information contained in this document without first obtaining professional advice. Past performance does not guarantee future results. Projections, although based on current information, may not be realized. Information, forecasts and opinions can change without notice and ABAL does not guarantee the accuracy of the information at any particular time. Although care has been exercised in compiling the information contained in this document, ABAL does not warrant that this document is free from errors, inaccuracies or omissions. ABAL disclaims any liability for damage or loss arising from reliance upon any matter contained in this document except for statutory liability which cannot be excluded. No reproduction of the materials in this document may be made without the express written permission of ABAL. This information is provided for persons in Australia only and is not being provided for the use of any person who is in any other country. The [A/B] logo is a registered service mark of AllianceBernstein and AllianceBernstein® is a registered service mark used by permission of the owner, AllianceBernstein L.P. © 2020 AllianceBernstein L.P